Vision insurance has become an established part of the insurance market, with coverage offered through employers, individual plans, and other benefit arrangements. The market is also changing as digital distribution, teleoptometry, and shifting consumer demands influence how vision benefits are purchased and used.
DecodeMBCodes breaks down the latest vision insurance statistics, covering the industry’s size and growth, U.S. market concentration, coverage types, distribution channels, end users, and regional market shares. The figures come from recent industry and government reports covering 2024 and 2025 data.
Vision Insurance Statistics – Market Size and Growth
The vision insurance market has expanded steadily in recent years, with growth reported both globally and in the United States. Looking at the market from these two perspectives provides a clearer picture of its current scale and how it is developing. The available figures also show that different reports use different definitions and measurements when assessing the industry.
Global Market
The global vision insurance market was valued at $47.8 billion in 2025, according to Dataintelo’s market analysis. The market is projected to reach $89.6 billion by 2034, representing a compound annual growth rate of 7.2% from 2026 through 2034.
The same analysis reports steady growth in the global market during the years leading up to 2025:
| Year | Global Market Size |
| 2019 | $31.2 billion |
| 2020 | $32.4 billion |
| 2021 | $34.8 billion |
| 2022 | $37.6 billion |
| 2023 | $40.9 billion |
| 2024 | $44.3 billion |
| 2025 | $47.8 billion |

U.S. Industry Revenue
The U.S. vision insurance industry was estimated at a different scale by IBISWorld, which reported expected industry revenue of $50.6 billion in 2025. U.S. industry revenue had expanded at a 1.8% CAGR over the previous five years, with revenue expected to increase by 3.0% in 2025.
These figures come from different market analyses and use different industry definitions, so the global market figure and U.S. industry revenue should not be treated as directly comparable measurements.
U.S. Vision Insurance Statistics Market Concentration
Government data provides a closer look at how vision insurance enrollment is distributed among insurers in the United States. The Government Accountability Office analyzed 2024 enrollment data from the National Association of Insurance Commissioners, with enrollment measured as of December 31, 2024.
In the group vision insurance market, the combined share of the three largest insurers varied substantially between states. Their share ranged from 41.2% to 95.5% of enrollment, while the median share was 77.4%.
The largest single insurer in each state’s group vision market accounted for between 15.8% and 81.9% of enrollment. The median share for the largest insurer was 40.9%, while the median number of insurers per state was 28.
The available figures highlight several characteristics of the U.S. market:
- Market concentration varies considerably from one state to another.
- A relatively small number of insurers account for a large share of enrollment in many states.
- The three largest insurers have a median combined share of more than three-quarters of group-market enrollment.
The GAO also examined vertical integration within the vision insurance industry. It found examples of insurers owning or operating provider offices, lens and frame manufacturers, and eyewear retail brands, although the report did not find aggregate data measuring the overall extent of vertical integration.
Vision Insurance Market by Coverage Type
Group vision insurance statistics represented the largest coverage segment in the global market in 2025, accounting for 42.5% of market revenue. Individual vision insurance followed with 35.8%, while family vision insurance represented 21.7%.
| Coverage Type | 2025 Market Share | Projected CAGR, 2026–2034 |
| Group Vision Insurance | 42.5% | 7.4% |
| Individual Vision Insurance | 35.8% | 7.0% |
| Family Vision Insurance | 21.7% | 6.8% |
The report projects continued growth across all three segments. Group vision insurance is expected to remain the largest category, while individual coverage is associated with the growth of direct-to-consumer platforms and coverage options for people without employer-sponsored benefits.
Vision Insurance Distribution Statistics
Offline distribution remained the larger channel in 2025, accounting for 63.7% of global vision insurance market revenue. Online distribution represented 36.3%.
The difference becomes more significant when projected growth rates are considered. Online distribution is expected to grow at a 9.2% CAGR from 2026 to 2034, compared with 6.2% for offline distribution.
The report identifies several factors associated with the growth of online distribution, including direct-to-consumer insurance platforms, insurance marketplace aggregators, embedded insurance offerings, and digital benefits enrollment.
Vision Insurance Market by End User
Enterprises accounted for the larger share of the global vision insurance market in 2025, representing 57.6% of total revenue. Individuals accounted for the remaining 42.4%.
The enterprise segment is projected to grow at a 7.3% CAGR through 2034, while the individual segment is projected to grow at 7.1%.
Employer-Sponsored Vision Benefits
Employer-sponsored coverage remains an important part of the market. The Dataintelo analysis reports that approximately 80% of large U.S. employers offer standalone or bundled vision benefits.
The report also identifies group vision insurance as the largest coverage category, with employer-sponsored benefits contributing to the segment’s position in the market.
Vision Insurance Market by Region
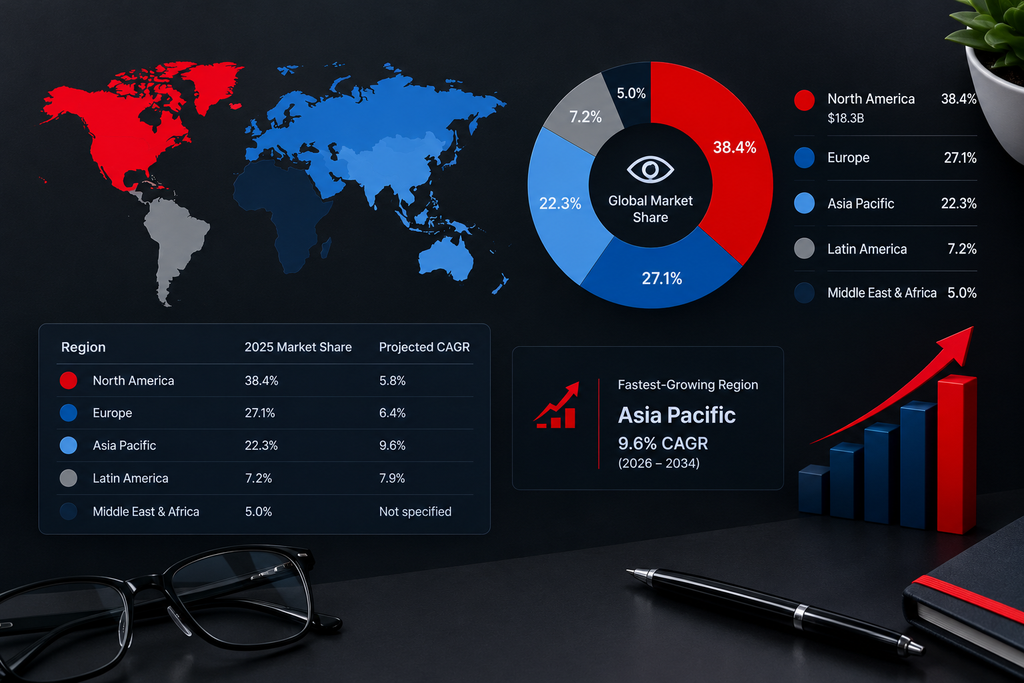
North America represented the largest regional share of the global vision insurance market in 2025, accounting for 38.4%, or $18.3 billion, in revenue.
Europe held the second-largest share at 27.1%, followed by Asia Pacific at 22.3%. Latin America accounted for 7.2%, while the Middle East and Africa represented 5.0%.
| Region | 2025 Market Share | Projected CAGR |
| North America | 38.4% | 5.8% |
| Europe | 27.1% | 6.4% |
| Asia Pacific | 22.3% | 9.6% |
| Latin America | 7.2% | 7.9% |
| Middle East & Africa | 5.0% | Not specified |
Asia Pacific is identified as the fastest-growing regional market, with a projected 9.6% CAGR from 2026 to 2034. North America is expected to maintain its leading position, supported by its established employer-sponsored benefits market.
Other Vision Insurance Industry Statistics
Several additional figures help illustrate the structure of the global vision insurance industry.
Insurance companies represented 61.3% of the global provider segment in 2025, making them the largest provider category. Healthcare providers accounted for 27.4%, while other providers represented 11.3%.
The market is also concentrated among major carriers in the United States. Dataintelo estimates that the five largest carriers collectively accounted for 58% to 62% of total U.S. vision insurance premiums in 2025.
Major Provider Statistics
The report identifies VSP Vision Care as the largest not-for-profit vision insurance provider in the United States, serving more than 88 million members through a network of more than 36,000 private-practice eye care professionals as of 2025. EyeMed Vision Care was reported to serve approximately 72 million members.
Another notable development is the expansion of digital vision care. The industry report estimates that teleoptometry can reduce the cost of eye care delivery by 25% to 35% compared with traditional in-office visits.
Conclusion
The available data shows a vision insurance industry that is evolving across several dimensions, from the way coverage is distributed among insurers to how consumers and employers access benefits. Market growth is occurring alongside changes in digital distribution, employer-sponsored coverage, and the competitive structure of the industry.
The statistics also show why the vision insurance market cannot be viewed as a single uniform market. Coverage types, distribution channels, regional markets, and state-level insurer concentration all present different patterns. Looking at these figures together provides a clearer picture of how the industry is structured today and where it is heading in the years ahead.
Sources used:
https://www.ibisworld.com/united-states/industry/vision-insurance/5914
https://www.gao.gov/products/gao-26-107787
https://dataintelo.com/report/global-vision-insurance-market
https://www.patientsrising.org/advocacy-updates/gao-vision-insurance-market-report