At DecodeMBCodes, we reviewed the latest available industry data to examine how often homeowners insurance claims occur and how much they cost. Homeowners insurance claims can vary considerably in frequency and cost depending on the type of loss, with property damage accounting for most claims and wind and hail, water damage, and fire among the leading causes.
This article examines homeowners insurance claims statistics, including how often insured homes experience claims, the most common causes of loss, average claim severity, and how claim patterns have changed over time.
Homeowners Insurance Claims Statistics at a Glance
The following figures provide an overview of the homeowners insurance claims statistics covered in the available industry sources:
- 5.33 claims per 100 insured homes were recorded in 2023, according to Triple-I data.
- 5.64 claims per 100 house-years was the weighted average from 2019 through 2023.
- $20,062 was the average claim severity in 2023.
- 97.3% of homeowners insurance claims in 2023 involved property damage, including theft.
- 32.6% of all 2023 claims were wind damage claims, according to ValuePenguin’s analysis.
- 20.1% of claims were non-weather water damage claims.
- 15.5% were hail claims.
- Fire and lightning claims were considerably less frequent but had the highest average claim severity among the major causes of loss.
The figures come from different reporting periods and datasets, so they should not be treated as a single uniform series.
Sources: (Triple-I, ValuePenguin)
How Often Do Homeowners File Insurance Claims?
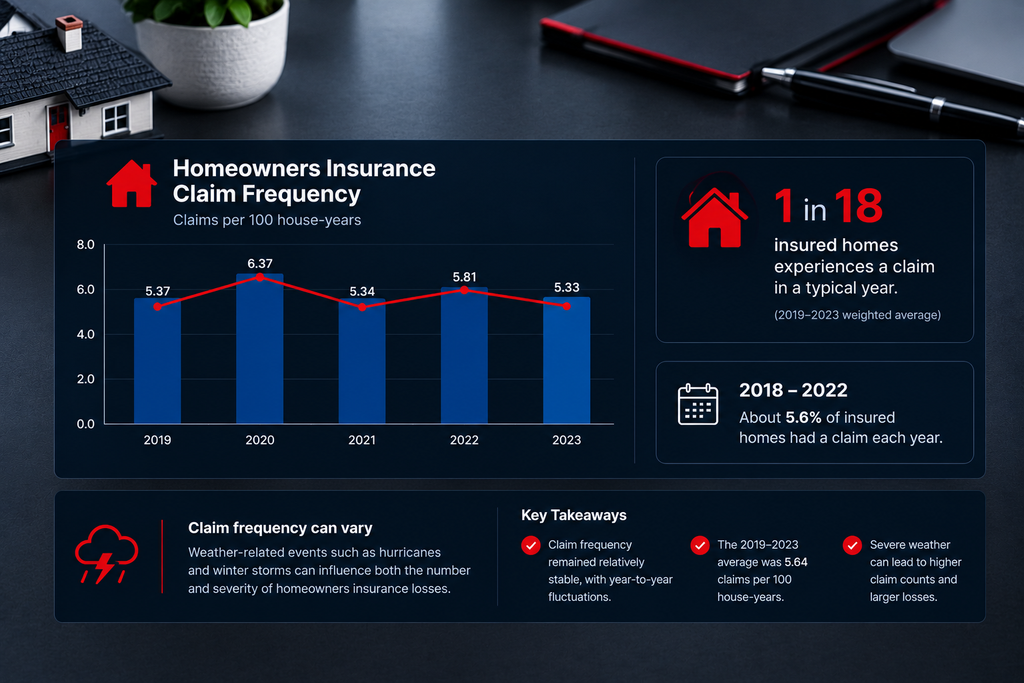
Triple-I data shows that claim frequency has remained relatively stable but fluctuated from year to year. Among homeowners multiple-peril policies, there were 5.37 claims per 100 house-years in 2019. Frequency increased to 6.37 in 2020 before falling to 5.34 in 2021.
The frequency increased again in 2022 to 5.81 before declining to 5.33 in 2023.
| Year | Claims per 100 house-years |
| 2019 | 5.37 |
| 2020 | 6.37 |
| 2021 | 5.34 |
| 2022 | 5.81 |
| 2023 | 5.33 |
| 2019–2023 average | 5.64 |
Based on the 2019–2023 weighted average, approximately 1 in 18 insured homes experiences a claim in a typical year.
Earlier data reported by the Insurance Information Institute shows a similar pattern. From 2018 through 2022, about 5.6% of insured homes had a claim each year.
The data also shows that claim frequency can change substantially from one year to another. Weather-related events such as hurricanes and winter storms can influence both the number and severity of homeowners insurance losses.
Sources: (Triple-I)
What Are the Most Common Homeowners Insurance Claims?
Property damage makes up the overwhelming majority of homeowners insurance claims. The insurance information institute data shows that property damage, including theft, accounted for 97.3% of claims in 2023, while liability claims accounted for 2.1%.
Within property damage, wind and hail, water damage and freezing, and fire and lightning were the largest categories.
| Cause of loss | Share of claims in 2023 |
| Wind and hail | 42.5% |
| Water damage and freezing | 22.6% |
| Fire and lightning | 21.6% |
| All other property damage | 10.0% |
| Theft | 0.6% |
| Liability | 2.1% |
| Credit card and other | 0.6% |
The percentages above come from Triple-I 2023 homeowners multiple-peril data. The category “water damage and freezing” includes mold damage when covered.
Sources: (Triple-I)
Wind, Hail and Water Damage Claims
Wind and hail are among the most frequent causes of homeowners insurance claims. According to the 2023 claims data analyzed by ValuePenguin, homeowners filed approximately 1.72 million wind claims that year, representing 32.6% of all claims. The number of wind claims has fluctuated considerably:
| Year | Wind claims |
| 2019 | 1.20 million |
| 2020 | 1.75 million |
| 2021 | 1.36 million |
| 2022 | 1.45 million |
| 2023 | 1.72 million |
Hail accounted for another 820,000 claims in 2023, or 15.5% of total claims. That was an increase from 550,000 hail claims in 2022 and 490,000 in 2021.
Water damage was also a major source of claims. In 2023, there were approximately 1.06 million non-weather water claims, representing 20.1% of all homeowners insurance claims. These included losses associated with problems such as burst pipes and leaking fixtures or appliances.
Weather-related water claims were much less common, with approximately 50,000 claims in 2023, accounting for less than 1% of all homeowners insurance claims in the ValuePenguin data.
Sources: (ValuePenguin)
Fire and Lightning Claims Are the Most Expensive
Fire and lightning claims occur less frequently than wind, hail, and water claims, but they can be substantially more expensive.
Triple-I data for 2018–2022 puts the average fire and lightning claim at $83,991, compared with an overall average homeowners insurance claim of $15,747 during the same period.
| Cause of loss | Average claim amount, 2018–2022 |
| Fire and lightning | $83,991 |
| Credit card and other | $34,183 |
| Bodily injury and property damage | $31,690 |
| Water damage and freezing | $13,954 |
| Wind and hail | $13,511 |
| Theft | $5,024 |
The difference between frequency and severity is particularly clear with fire. According to U.S. News data, only about 1 in 425 insured homes filed a fire or lightning claim each year, yet the average claim was substantially higher than the average for other major property-damage categories.
Separate III data on non-catastrophe fire losses also shows how costly these claims can become. Average severity for these claims increased from $99,613 in 2020 to $173,111 in 2024.
Sources: (Triple-I, U.S. News)
How Much Does the Average Homeowners Insurance Claim Cost?
The average cost of a homeowners insurance claim depends on the reporting period and dataset.
ISO’s homeowners multiple-peril data shows average claim severity of $13,884 in 2019, rising to $14,864 in 2020, $16,601 in 2021, $19,740 in 2022, and $20,062 in 2023.
| Year | Average claim severity |
| 2019 | $13,884 |
| 2020 | $14,864 |
| 2021 | $16,601 |
| 2022 | $19,740 |
| 2023 | $20,062 |
| 2019–2023 average | $17,059 |
This represents the average amount paid per claim based on the Triple-I methodology described in the source data.
The historical figures also show why claim frequency alone does not tell the whole story. A year can have fewer claims while still producing higher overall claim costs if the losses that occur are more severe.
For comparison, the U.S. News data covering 2018–2022 reports an average claim amount of $15,747. The different five-year period and underlying data explain why this figure should not simply be substituted for the Triple-I’s 2019–2023 figure.
Sources: (Triple-I, U.S. News)
Homeowners Insurance Claims Statistics by State
Homeowners insurance losses vary significantly by location because different parts of the country face different types and levels of risk. The leading causes and costs of claims can therefore look very different from one state to another.
States With the Highest Claim Costs by Damage Type
The 2023 data shows substantial differences in which states experienced the highest costs for specific types of homeowners insurance claims.
| Damage type | States with the highest claim costs |
| Wind damage | Florida, Iowa, Kentucky, Louisiana, and Maryland |
| Hail damage | Colorado, Iowa, Minnesota, Nebraska, and South Dakota |
| Fire damage | Hawaii, Alaska, California, Colorado, and Washington, D.C. |
| Non-weather water damage | Arizona, California, Nevada, Rhode Island, and Washington |
Historical loss data also shows substantial differences between states. From 2015 through 2019, California recorded the highest total average homeowners insurance losses in the Policygenius dataset at approximately $10.73 billion, followed by Florida at $6.48 billion and Texas at $5.86 billion.
Sources: (ValuePenguin, Policygenius)
Natural Disaster Exposure by State
Natural disaster exposure is another important part of the state-level picture. The supplied data identifies more than 2 million California properties at risk of wildfire damage in 2021. Florida had nearly 2.85 million homes at risk from a Category 5 hurricane, making it particularly exposed to severe tropical weather.
These figures measure exposure and losses differently, so they should not be interpreted as a ranking of states by claim frequency. Instead, they illustrate how the type and severity of risks facing homeowners can vary considerably depending on where a property is located.
Sources: (Policygenius)
How Homeowners Insurance Claims Have Changed
The available data shows that both claim frequency and claim severity can change substantially over time. Looking at these measures together provides a clearer picture of how homeowners insurance losses have developed.
Claim Frequency Has Declined Since 2020
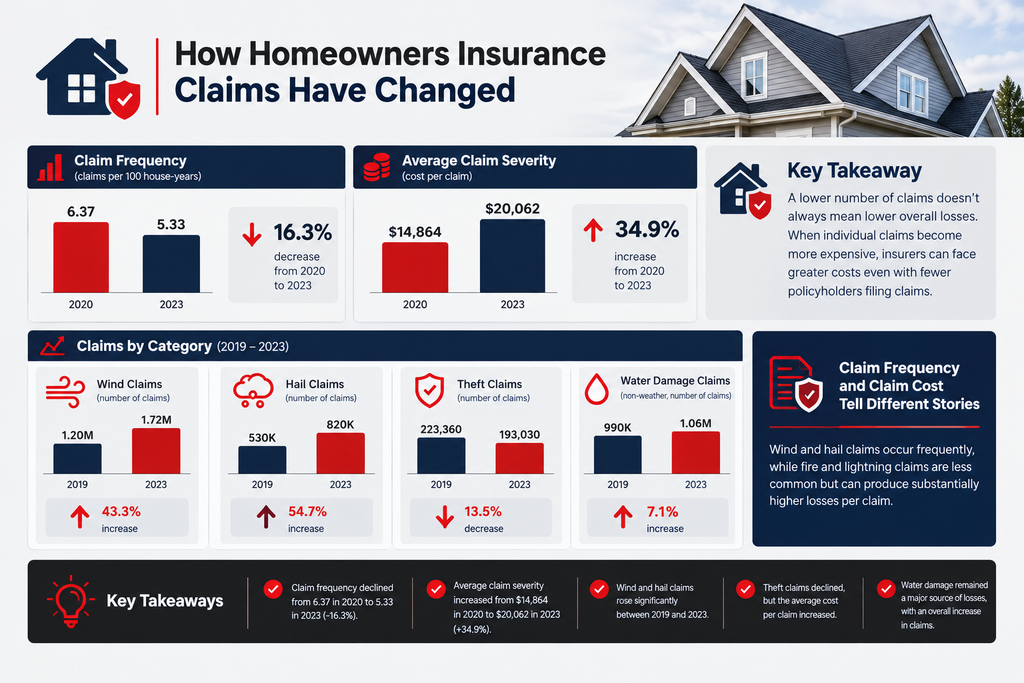
Triple-I recorded a claim frequency of 6.37 claims per 100 house-years in 2020, compared with 5.33 in 2023. This indicates that insured homes were less likely to experience a claim in 2023 than they were in 2020.
The longer-term figures also show some variation from year to year, with weather conditions and other causes of property damage contributing to changes in the number of claims filed.
Average Claim Severity Has Increased
While claim frequency declined between 2020 and 2023, the average cost of a claim moved in the opposite direction. Triple-I recorded average claim severity of $14,864 in 2020, compared with $20,062 in 2023.
This difference is important because a lower number of claims does not necessarily mean lower overall losses. When individual claims become more expensive, insurers can face greater costs even when fewer policyholders file claims.
Wind and Hail Claims Have Increased
Wind and hail remain major sources of homeowners insurance claims, and the number of claims in both categories increased between 2019 and 2023.
Wind claims increased from 1.20 million in 2019 to 1.72 million in 2023. Hail claims also increased, rising from 530,000 to 820,000 over the same period.
The increase in these weather-related claims highlights the significant role that severe weather plays in homeowners insurance losses.
Theft Claims Have Declined
Theft claims have followed a different trend. The number of theft claims declined from 223,360 in 2019 to 193,030 in 2023.
The supplied ValuePenguin data shows that theft claims fell 15.8% from 2022 to 2023. However, the average cost of an individual theft claim increased by 1.9% during the same period.
This means that fewer theft claims were filed, but the claims that did occur were slightly more expensive on average.
Water Damage Remains a Major Source of Claims
Water damage has also remained a significant source of homeowners insurance losses. Non-weather water claims increased from approximately 990,000 in 2019 to 1.06 million in 2023, according to the supplied ValuePenguin data.
These claims include losses associated with issues such as burst pipes, leaking fixtures and appliances. Weather-related flooding is generally treated separately from these non-weather water losses.
Claim Frequency and Claim Cost Tell Different Stories
The changes across individual claim categories show why homeowners insurance losses cannot be evaluated by claim frequency alone. Wind and hail claims occur frequently, while fire and lightning claims are less common but can produce substantially higher losses per claim.
Overall, the data points to a homeowners insurance market in which the frequency of individual losses can move in different directions while the financial impact of claims continues to change. Looking at both measures provides a more complete picture of how homeowners insurance claims have evolved.
Conclusion
Homeowners insurance claims can vary considerably in both frequency and cost, depending on the type of loss and the conditions surrounding it. Looking at claims over several years provides a clearer picture of how property damage, weather events and other losses affect the homeowners insurance market.
The available data also shows why a single claims statistic rarely tells the whole story. A cause of loss may occur frequently without producing the largest financial losses, while less common events can result in substantially higher costs when they do occur.
Taken together, homeowners insurance claims statistics provides a useful view of the risks insurers and homeowners face across the country. Examining both the frequency and financial impact of claims gives a more complete understanding of how homeowners insurance losses have changed over time.
Sources used:
- https://www.iii.org/fact-statistic/facts-statistics-homeowners-and-renters-insurance
- https://www.valuepenguin.com/home-insurance-statistics
- https://www.policygenius.com/homeowners-insurance/homeowners-insurance-statistics/
- https://www.usnews.com/insurance/homeowners-insurance/most-common-claims
- https://www.simplyinsurance.com/how-many-people-have-homeowners-insurance/
- https://www.moneygeek.com/insurance/homeowners/homeowners-insurance-statistics/